International Trade | Ukraine’s Unsustainably Large Public Sector | Fixed Exchange Rates a Disaster | Conclusion | View in PDF
[wc_row] [wc_column size=”one-half” position=”first”] [wc_image attachment_id=”3481″ title=”Olena Bilan” alt=”Olena Bilan” caption=”” link_to=”” url=”” align=”left” size=”thumbnail”][/wc_image]Meet the Author
Olena Bilan is chief economist at Dragon Capital, Ukraine’s leading investment bank, and a member of Editorial Board of VoxUkraine.
[/wc_column] [wc_column size=”one-half” position=”last”] [wc_image attachment_id=”3482″ title=”Oleksandr Zholud” alt=”Oleksandr Zholud” caption=”” link_to=”” url=”” align=”left” size=”thumbnail”][/wc_image]Meet the Author
Oleksandr Zholud is senior analyst of the International Centre for Policy Studies (ICPS) and a member of Editorial Board of VoxUkraine.
[/wc_column] [/wc_row]Ukraine is the second largest country in Europe, and sixth most populous, making it one of the biggest consumer markets in the region.[note]Data excludes Crimea, occupied by Russia since March 2014. Its area takes up 27,000 km2, population stood at 2.4m people in 2013 (5.2% of total) and GDP accounted for 3.8% of Ukraine’s total in 2013[/note] A favorable geographic position establishes the country as a natural transportation link between Europe, Russia, and Central Asia. Ukraine is rich in natural resources, such as iron ore and coal, and is richly endowed with chernozem, one of the most fertile types of soils in the world.[note]“Ukraine,” Encyclopedia Britannica, updated 8 September 2016.[/note]
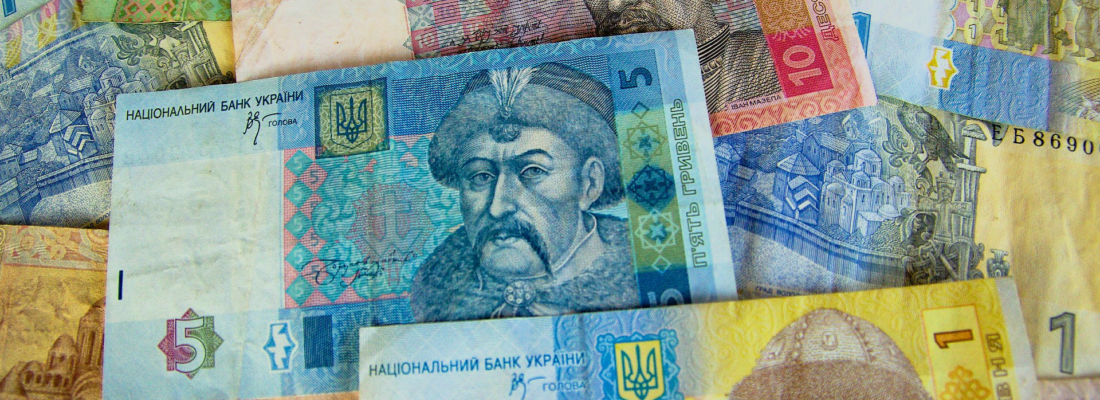
These advantages, however, have not translated to financial well-being for Ukraine’s people. Structurally, Ukraine is a relatively small, open, and commodity-based economy. In 2015, it ranked 64th globally by nominal GDP ($91 billion) and was 49th by GDP at purchasing power parity (PPP). Ukraine’s per capita GDP stood at $2,125 ($7,971 at PPP) last year, ranking it 135th worldwide (118th based on PPP). Ukraine’s external trade turnover is equivalent to 107% of GDP.[note]See, for example, “Ukraine Exports” on Trading Economics at http://www.tradingeconomics.com/ukraine/exports.[/note]
[wc_row] [wc_column size=”one-half” position=”first”]
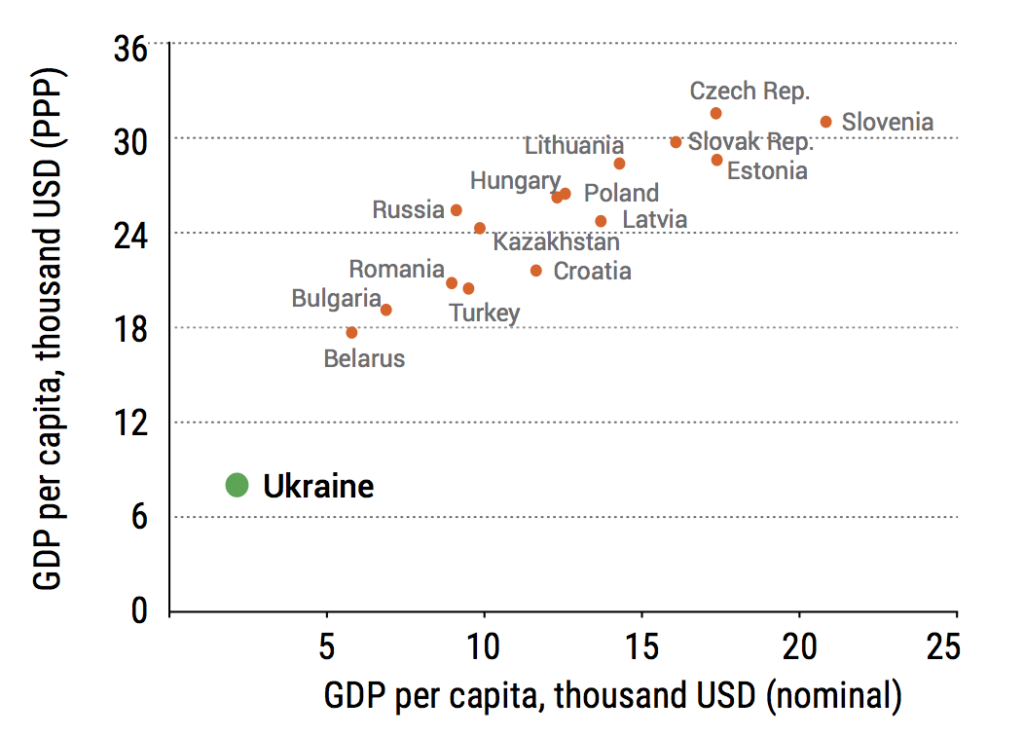
Figure 1. GDP Per Capita: Ukraine vs. Regional Peers (2015)
Source: IMF, Dragon Capital
[wc_center max_width=”400px” class=”” text_align=”center”]
Figure 2. External Trade Turnover: Ukraine vs. Regional Peers (% of GDP; 2015/latest available data)
Source: World Bank, Dragon Capital
[/wc_center]
[/wc_column]
[/wc_row]
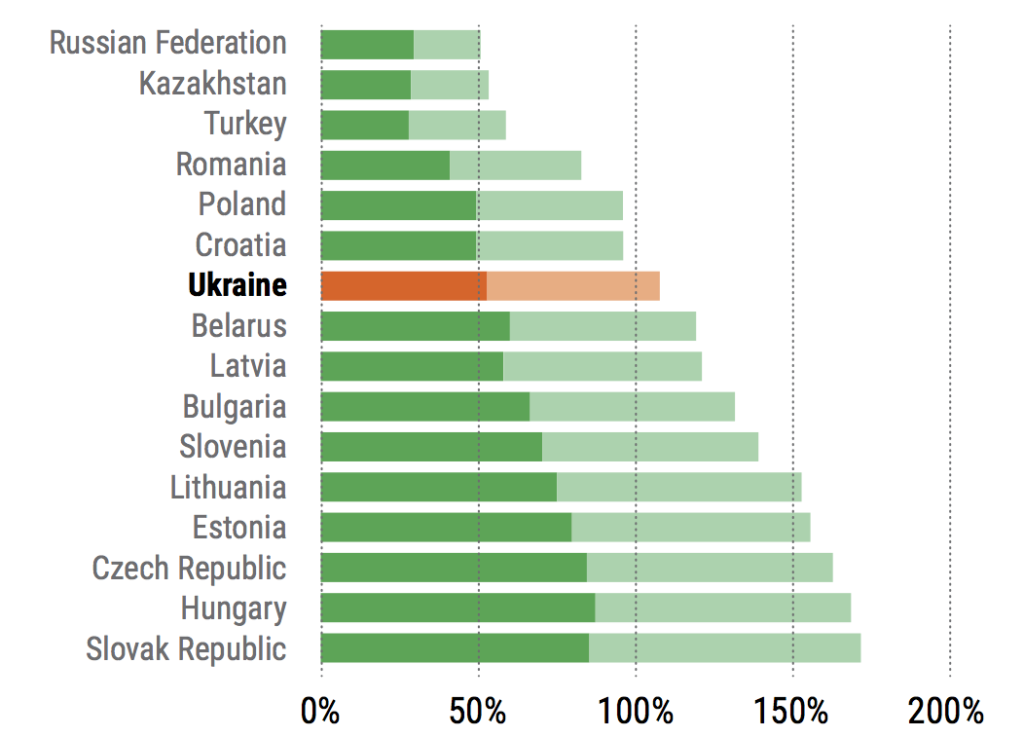
Heavy industry is a key sector of Ukraine’s economy due to the country’s ample natural resources and the forced industrialization in the Soviet era. Industry accounted for 26% of gross value added in 2015 and has an even larger impact on GDP due to its interdependence with other economic sectors, particularly rail transportation. Agriculture has grown significantly in recent years, nearly doubling its share in gross value added from 7.5% in 2007 to 14% in 2015, one of the highest ratios in the region.
[wc_row] [wc_column size=”one-half” position=”first”]
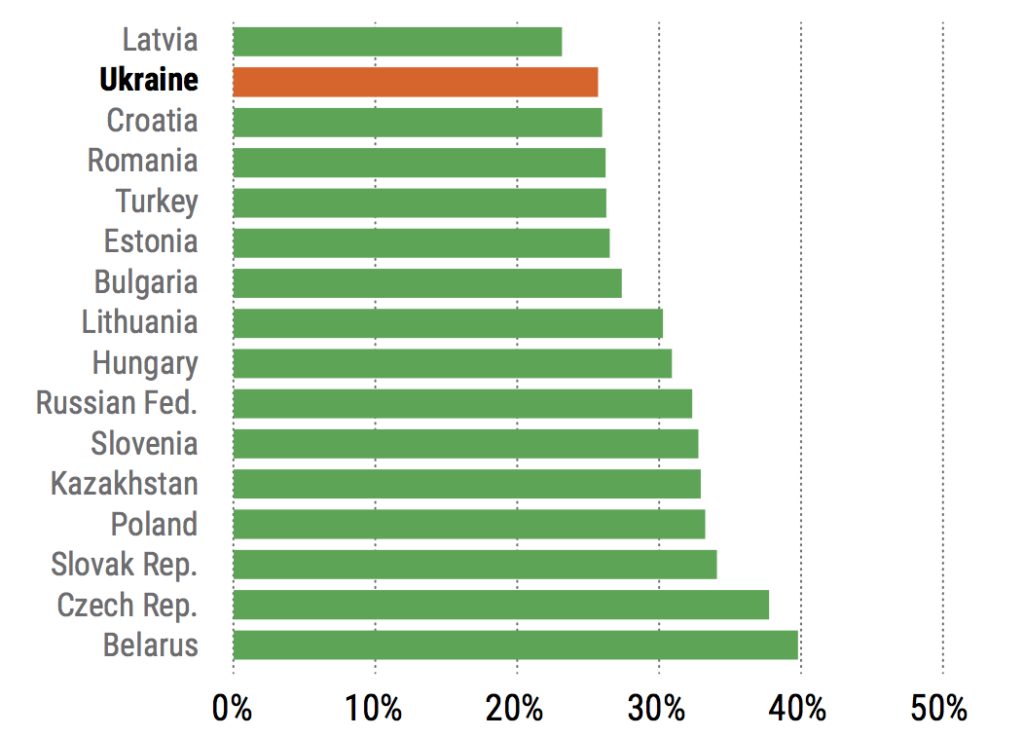
Figure 3. Share of Industry4 in Gross Value Added5: Ukraine vs. Regional Peers (%; 2015/latest available data)
Source: World Bank, Dragon Capital
[wc_center max_width=”400px” class=”” text_align=”center”]
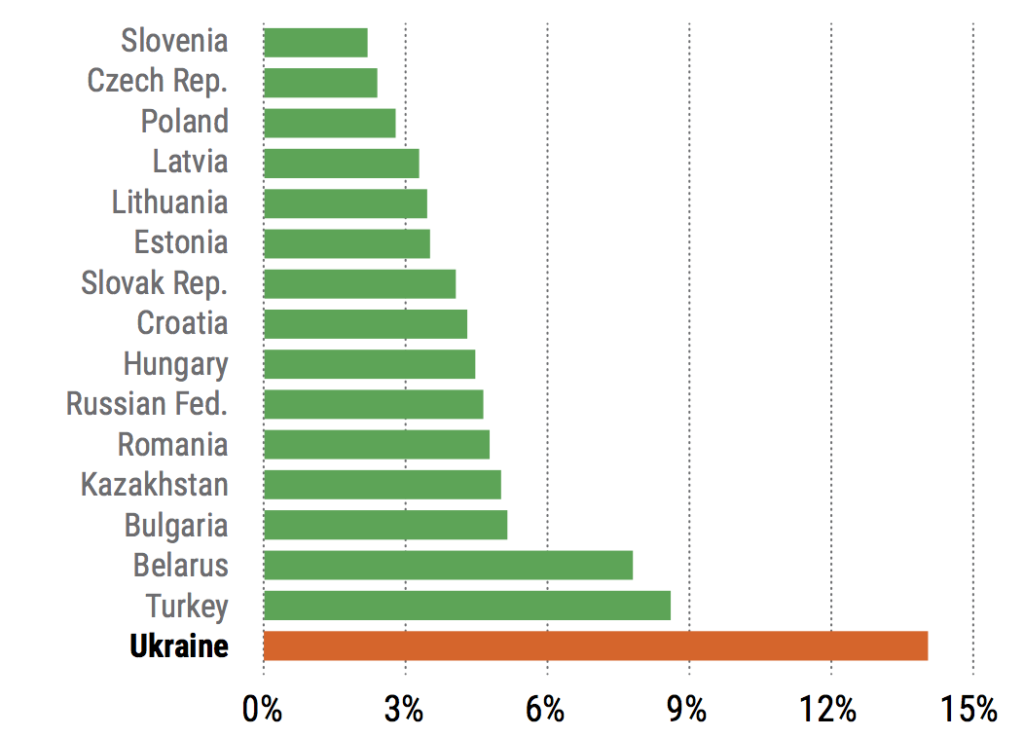
Figure 4. Share of Agriculture in Gross Value Added: Ukraine vs. Regional Peers (%; 2015/latest available data)
Source: World Bank, Dragon Capital
[/wc_center]
[/wc_column]
[/wc_row]
INTERNATIONAL TRADE
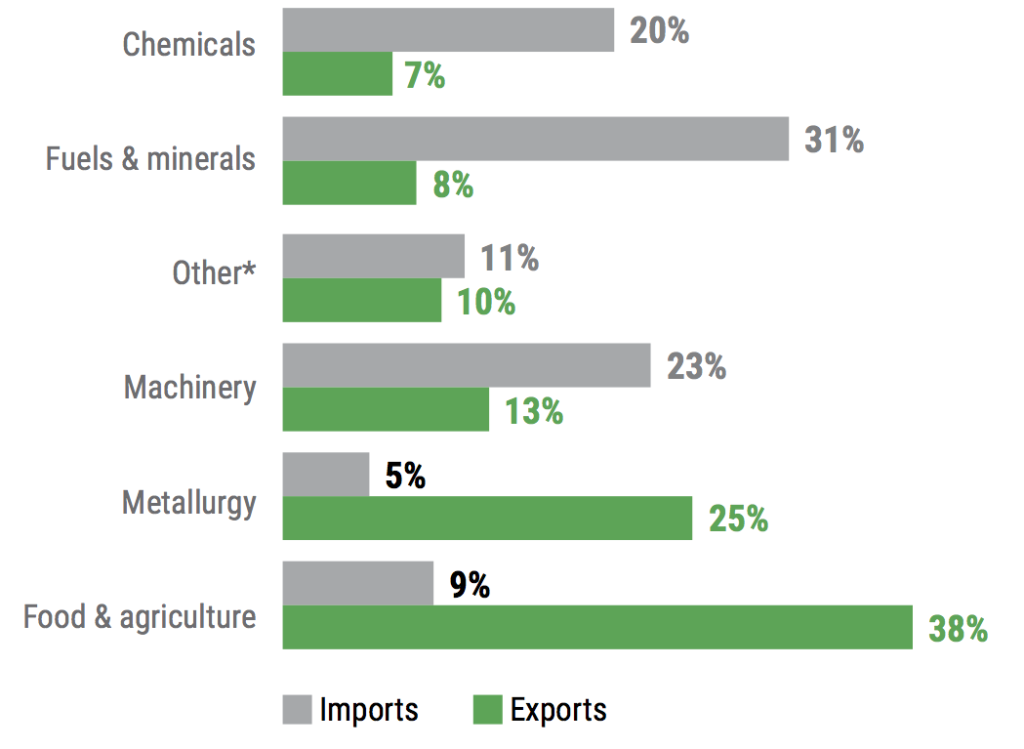
Commodities account for two-thirds of the country’s merchandise exports, one of the highest proportions in the region, trailing only Russia and Kazakhstan. In contrast to its oil and gas-rich neighbors, Ukraine is dependent on metallurgy, mining, and soft commodities exports. The share of metals in total exports has been shrinking, from 42% in 2007 to 25% in 2015, while the share of soft commodities (grain, oilseeds, and vegetable oils) has been trending higher since 2010, from 8% in 2005 to 29% in 2015 (the figure stands at 38% if other processed foods are added). This percentage remains the highest in the region, reflecting Ukraine’s status as one of the world’s largest producers and exporters of agricultural commodities. Machinery and manufactured consumer goods make up the bulk of non-commodity exports.
[wc_row] [wc_column size=”one-half” position=”first”]
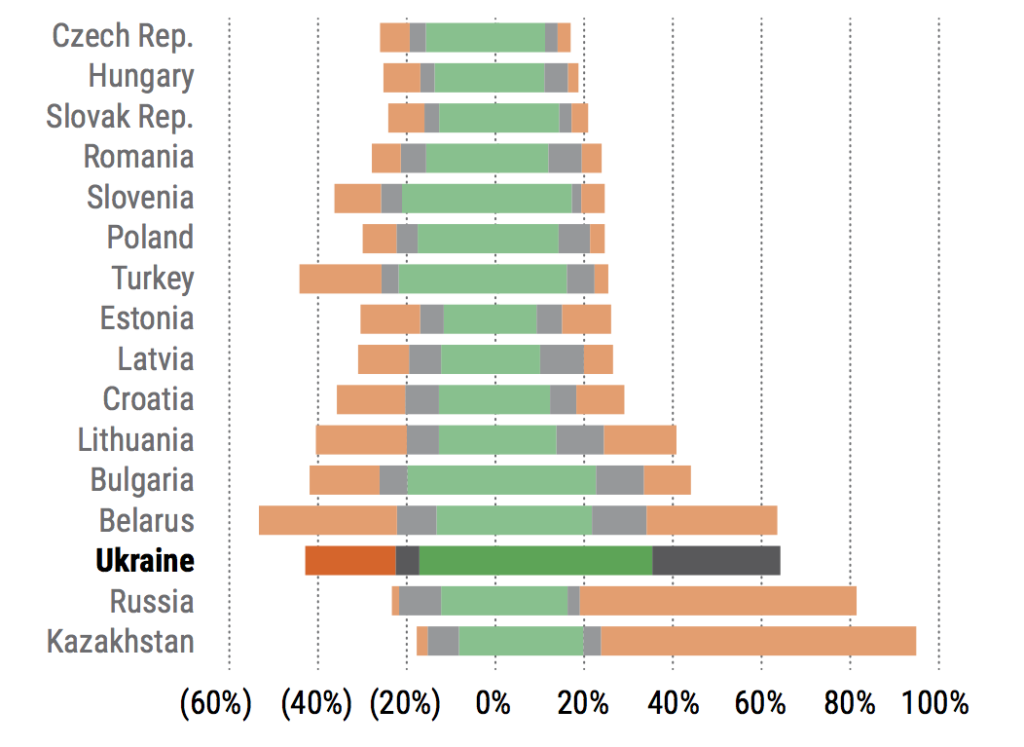
Figure 5. Commodities in Foreign Trade: Ukraine vs. Regional Peers (2015, % of total exports and imports)
Source: ITC, Dragon Capital estimates
[wc_center max_width=”400px” class=”” text_align=”center”]
Figure 6. Ukraine’s Merchandise Trade Structure (2015; $billion)
Note: *mostly consumer goods. Source: NBU, Dragon Capital
[/wc_center]
[/wc_column]
[/wc_row]
The share of energy commodities in total merchandise imports shrunk to 20% in 2015 after peaking at 35% in 2011, and consisted of natural gas and oil products. Despite a significant decline in energy imports, the Ukrainian economy remains quite energy inefficient, as the country inherited extremely energy-intensive industrial and utilities sectors from the Soviet Union. Since then, Ukraine has made limited progress to reform energy efficiency.
Ukraine’s exports are highly dependent on global commodity cycles and the state of the world economy. Ukraine’s real GDP grew at 7.5% per year on average from 2000-2007, supported by favorable global growth, skyrocketing global commodity prices, and loose domestic policies. During the global economic crisis in 2008-2009, Ukraine’s economy shrank 15.1% per year, but recovered to the same level of moderate growth witnessed between 2010-2013 at an average of 2.5% GDP growth. Ukraine’s real GDP declined by 6.6% in 2014 and by 9.9% in 2015, as the economy suffered due to Ukraine’s military conflict with Russian-backed separatists.[note]See data on Ukriane’s GDP attradingeconomics.com/ukraine/gdp[/note]
[wc_center max_width=”600px” class=”” text_align=”center”]
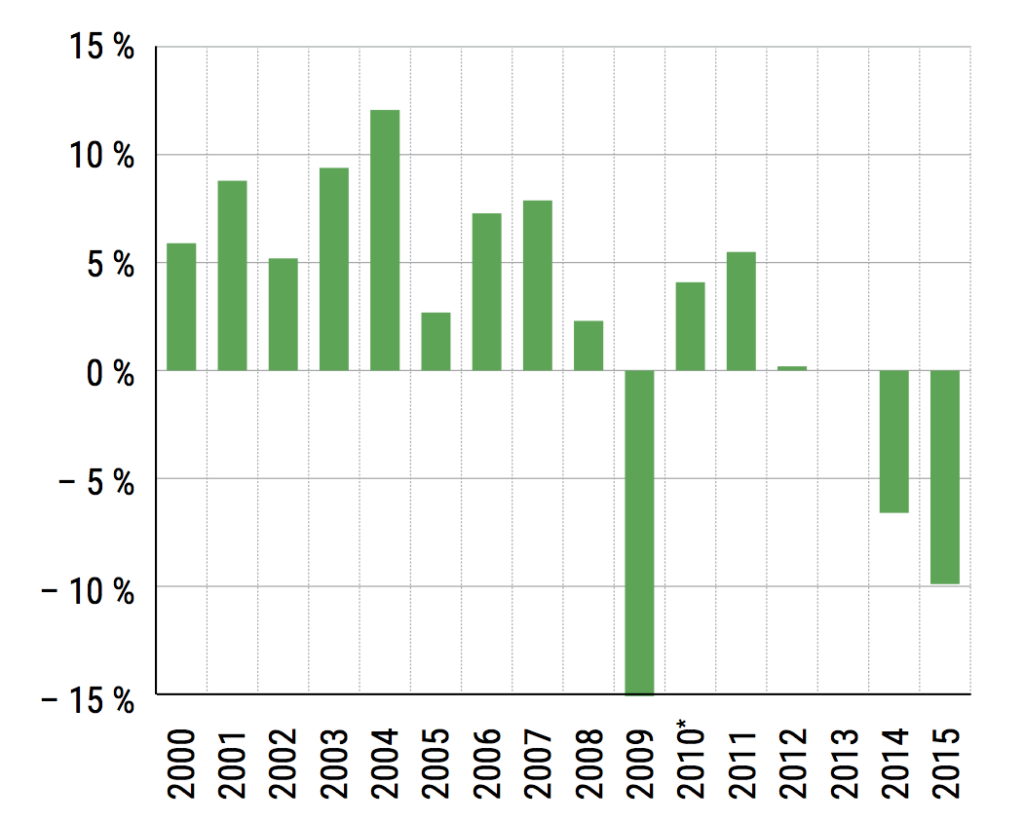
Figure 7. Change in Ukraine’s Real GDP (% y-o-y)
Note: *2010 data and onwards exclude Crimea. Source: State Statistics Service (SSS)
[/wc_center]
Both exports and imports of goods shrank significantly in 2014-2015, by 41% and 52.3% respectively, due to low prices for Ukrainian exports and an extremely sharp reduction of trade with Russia, which accounted for a quarter of total exports before the conflict. Ukraine’s current account improved because imports fell more significantly than exports, from a deficit of 8.7% of GDP in 2013 to 0.2% in 2015, which decreased demand for hard currency to finance the gap. It seems likely that the balance will remain close to zero in the next few years.
Ukrainian exports are still largely dependent on commodities — chiefly steel, wheat, corn, sunflower seeds and oil. Prices for these commodities have fluctuated greatly, sometimes doubling or halving in a year, which has affected export revenues and therefore the exchange rate. The Free Trade Agreement (FTA) with the EU could ameliorate this problem, but even after the agreement was signed, there were no significant structural changes in exports to the EU. The devaluation that occurred over 2014-2016 should boost exports, but new production also requires an inflow of investment which depends on structural reforms such as strengthening protection of property rights and the rule of law.
Has the structure of exports improved or worsened in 2014-2015? The balance of payments improved but this was due to the falling value of the hryvnia (Ukraine’s currency). Did devaluation give a boost to domestic production?
UKRAINE’S UNSUSTAINABLY LARGE PUBLIC SECTOR
Many economists argue that one of the major impediments to Ukraine’s economic development is excessive redistribution through the public sector.[note]“What is the optimum level of public spending in Ukraine?” Center for Economic Strategy, 2 November 2015.[/note] The Ukrainian government’s ratio of public spending to GDP increased significantly since the early 2000s, from 35.5% of GDP in 2000 to 48% in 2013.[note]“World Economic Outlook Databases,” International Monetary Fund, accessible at imf.org/external/ns/cs.aspx?id=28[/note] This increase had to be supported by both a higher tax burden and a higher budget deficit. In other former Soviet countries, one can observe similar trends towards a larger public sector, but to a smaller extent than in Ukraine.
[wc_center max_width=”500px” class=”” text_align=”center”]
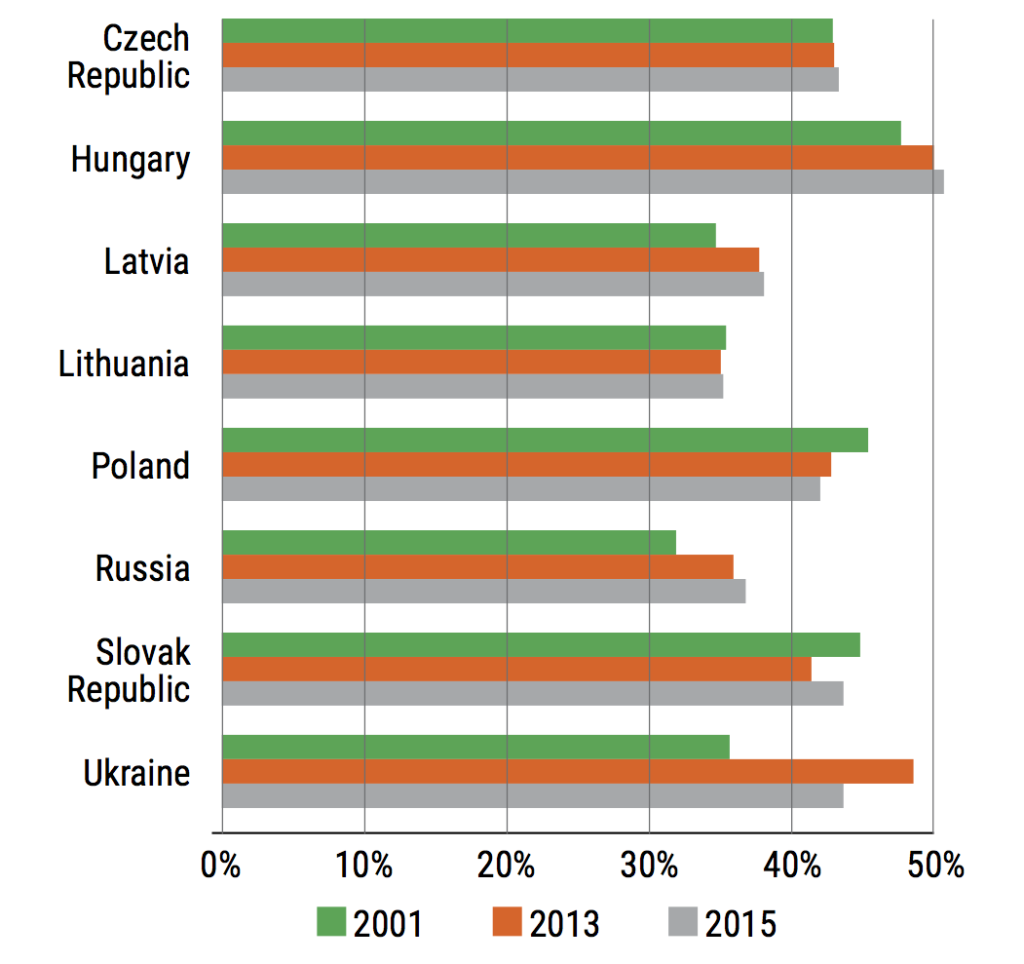
Figure 8. Ratio of public spending to GDP in selected countries 2001, 2013 and 2015
International Monetary Fund, World Economic Outlook Database, April 2016
[/wc_center]
In the past, public spending has been primarily directed to current consumption through social transfers, while public investment has usually been small. In 2013, household incomes consisted almost equally of wages (42%) and social transfers (38%), particularly pensions.[note]“Income and Expenditures of the Ukrainian Population,” State Statistical Service of Ukraine, July 2016.[/note]
[wc_center max_width=”500px” class=”” text_align=”center”]
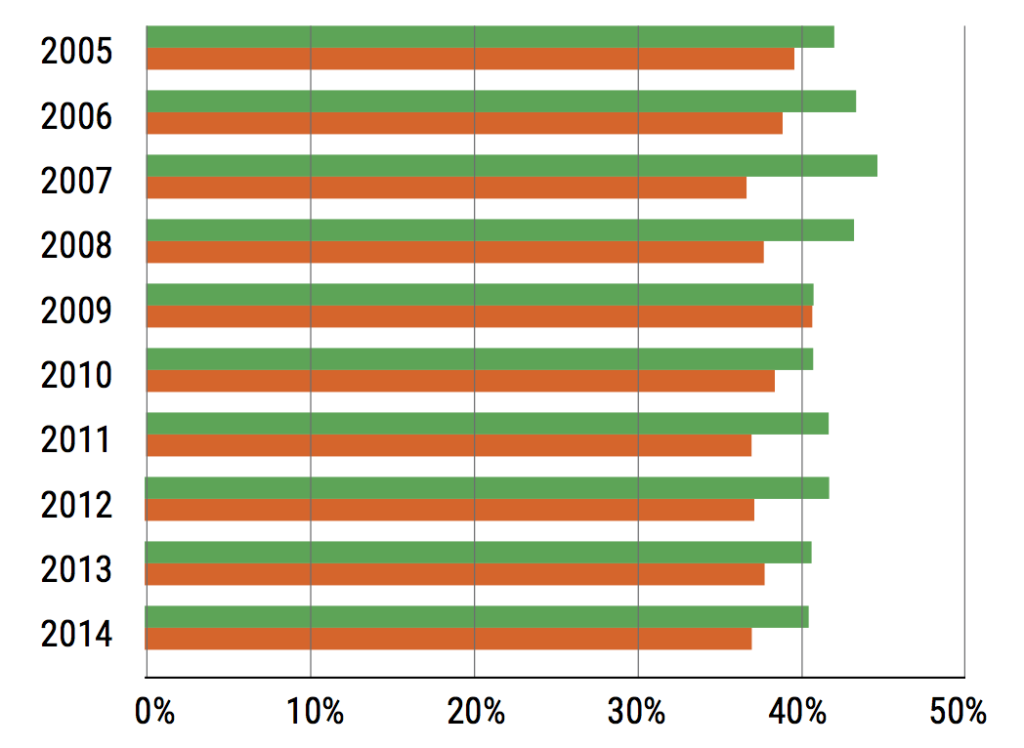
Figure 9. Components of household incomes – wages and social transfers
SSSU
[/wc_center]
The Ukrainian pension system is in dire need of reform. The state pension fund (SPFU) has run a significant deficit financed by the state budget since 2004, when pensions were increased in order to bolster popular support ahead of presidential elections. No government since then has been able to substantially decrease the deficit. The primary source of SPFU revenues has been a social fee based on paychecks. Before 2015, it was was proportionally one of the largest taxes in Europe (about 46%), therefore it was not possible to balance the SPFU finances by further increasing the size of the social fee. In 2016, Ukraine decided to cut the social fee by more than half, down to 22%, hoping to create incentives for employers to pay wages legally. So far, these hopes have not been realized. Currently, the largest single item in budget spending for 2016 is a transfer to the SPFU in order to finance its deficit of 144 billion Ukrainian hryvnia (UAH), which is close to 10% of Ukraine’s GDP and one third of all budget expenditures.
While taxes were reduced in 2014-2015, Ukraine’s tax administration remains a serious issue that demands further attention. For example, for the last 20 years, Ukraine has struggled with with value-added tax refund arrears. Each time there have been shortages in actual budget revenues compared to projections, this issue has been reignited.
One of the most important reforms in public finance since the Maidan is the new public procurement system Prozorro. Since August 1, 2016, all public procurement of goods and services above a value of UAH 200 thousand and for projects costing more than UAH 1.5 million must be made using a system of public, electronic procurement. In the interest of increasing competition and foreign investment, foreign companies are also able to participate in these tenders. Prior to the introduction of the system, corruption was rampant in public procurement, which limited participation and showed bias in excluding some participants. The amount of ‘corrupt rent’ (i.e., the share of payment that was used as a bribe) differed from tender to tender, but the average estimate had been about a third of the procurement’s value.
The Ukrainian budget has been in deficit since 2000. The deficit was financed roughly equally by domestic and external borrowing. Because of the de facto pegged exchange rate and large nominal GDP growth, gross public debt looked quite small and manageable despite the fact that interest rates were notably higher than in the developed countries (5-10% per year, in USD). In 2007, the debt-to-GDP ratio was just 11.8%. During the global financial crisis, the Ukrainian government borrowed heavily, which boosted the ratio to 40.6% by 2010. By the Maastricht criterion of 60%, Ukraine’s public debt was still considered safe.
In 2014-2015, due to the sharp depreciation of the hryvnia and the decline in real output, the debt-to-GDP ratio increased to 80.2% and will remain above the 60% mark until at least 2021, according to IMF forecasts. In 2015, in order to reduce the public debt burden, Ukraine managed to strike a deal with its eurobond holders, excluding Russia, in order to receive a debt “haircut” (a write-off of part of the debt) and extend principal repayment dates. Even despite these positive steps, debt servicing is the second largest item in budget expenditure: in 2015, debt servicing cost UAH 86.8 billion, comprising 15% of state budget expenditures.
Due to costly social commitments, its large defense outlays, and its debt burden, Ukraine’s best hope for sustainably improving public revenues is economic expansion. To achieve this goal, the most pressing issues to be resolved are property rights protection and deregulation.
Because of its high social commitments and large debt-burden, Ukraine cannot reduce taxes much, so its only hope is increasing the size of the pie. For this, the most important steps are deregulation and protecting property rights.
FIXED EXCHANGE RATES A DISASTER
Until 2014, the primary goal of Ukrainian monetary policy appeared to be fixing the UAH/USD exchange rate, although it was never explicitly defined that way by the central bank. Adverse external shocks led to periods of sharp depreciation of the hryvnia with a corresponding spike of inflation. During positive conditions in external markets, the fixed exchange rate led to growing foreign reserves and non-sterilised interventions on the foreign exchange market, leading to loose monetary policy and high inflation rates.
During the commodity boom in 2003-2008, there was a great influx of foreign currency, augmented after 2005 with excessive optimism from investors, particularly regarding the banking sector. Several large European financial groups entered the market, and large banks actively tapped foreign capital markets. The inflow of foreign currency and real appreciation of the hryvnia led to massive current account deficits and external debt growth (see Figure 12). A notable share of banking system liabilities was in foreign currency, while hard currency loans were liberally given to many borrowers without hard currency incomes.
[wc_center max_width=”800px” class=”” text_align=”center”]
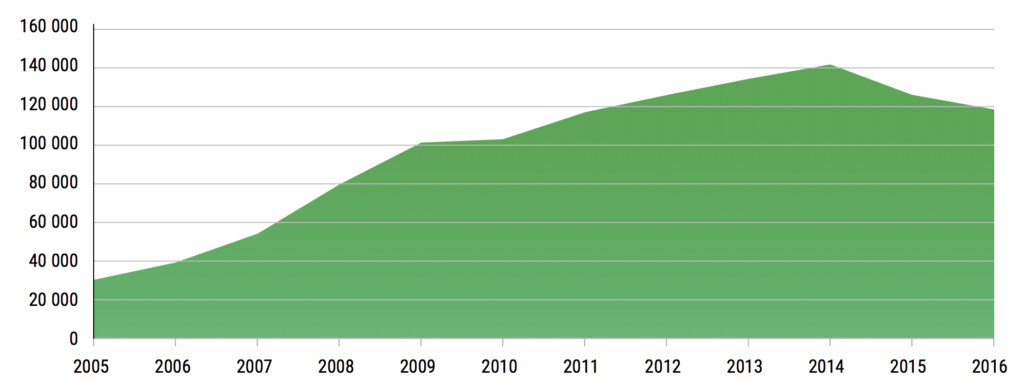
Figure 11. External debt of Ukraine, as of January 1
Source: National Bank of Ukraine
[/wc_center] In 2012-2013, the Ukrainian government maintained the exchange rate peg despite the onset of a recession. This led to a fall in foreign exchange reserves from USD 38 billion in August 2011 to USD 20.4 billion in December 2013. The war in Donbas, the occupation of Crimea, and the severe deterioration of external trade led to further decreases in reserves to just USD 5.6 billion in February 2015, by which time the central bank had no other option than to float the hryvnia. In order not to repeat its previous errors, the central bank started to shift toward inflation targeting as an explicit policy. Nevertheless, there are many restrictions on free capital flow, and currency market regulations are still in place.
[wc_center max_width=”800px” class=”” text_align=”center”]
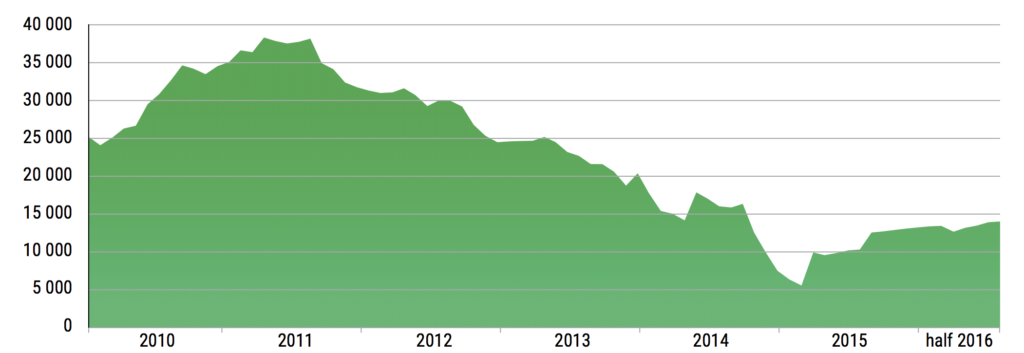
Figure 12. Foreign currency reserves, million USD
Source: National Bank of Ukraine
[/wc_center]
The Ukrainian banking system is plagued by insider lending and low-quality collateral. The war, the sharp depreciation of the hryvnia, and the economic recession led to rapid growth in non-performing banks, many of which had problems since the 2008-2009 crisis but were kept afloat artificially. The central bank decided to clean the system, and in 2014-2016 roughly a third of banks were declared bankrupt, including several of the largest ones. This led to a massive outflow of deposits and a system-wide run on banks.
Currently, one of the main problems is restoring trust in the banking system. A healthy banking sector and the re-launch of banking lending are two of the most important steps in restoring economic growth.
A healthy banking sector and the re-launch of the banking financing is the key to restoring growth. Therefore, the NBU should continue to clean the sector, while at the same time gradually reducing key rates.
CONCLUSION
According to the IMF, the Ukrainian economy has started to recover. In 2016, annual GDP growth will turn positive for the first time in three years, showing 1.5% growth.[note]“IMF Executive Board Completes the Second Review under EFF with Ukraine, Approves US$1 Billion Disbursement,” IMF Press Release 16/407, 14 September 2016. www.imf.org/en/news/articles/2016/09/14/pr16407-ukraine-imf-executive-board-completes-the-second-review-under-eff[/note] In the years 2017–2021, economic expansion should accelerate but cumulative growth for the period will be just enough to make up for the previous contraction. These figures are not very promising: per capita GDP will remain below 2013 levels in dollar terms until the year 2021. Reaching the level of even the poorest EU members will take decades.
Inflation is projected to slow from 43.3% in 2015 and 12% in 2016 to single digits, with a long term annual inflation of 5%. Low and stable inflation should increase the predictability of investments and increase trust in the banking system.
The current account balance will run a small deficit (2.0–2.5% of GDP) that should be covered by an increased inflow of investments from abroad. It is paramount to create possibilities for such investments by improving the regulatory climate and strengthening the rule of law. Otherwise, the deficit will further weaken hryvnia, which in turn risks undoing the success of the current inflation policy.
Ukraine faces many risks that make any medium-term forecasts quite tentative. Ukraine must create conditions for high, sustainable growth if it hopes to catch up the EU. Therefore, it is essential to improve the economic climate through the rule of law and making the country an attractive place for foreign investors.
[wc_share_buttons class=””][/wc_share_buttons]The views above are those of the author.